The tree of human history. (1996)
Geographical distribution of humans.
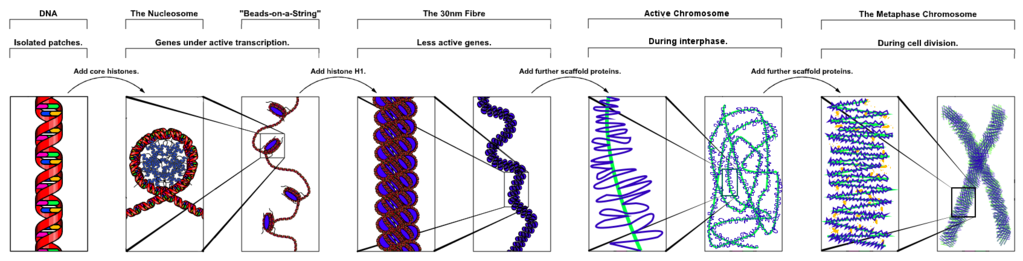
From DNA to chromosome.
The national geographic interactive map.
For the listening exam, listen to this file and take notes.
These maps will help you understand the listening.
Friday, June 13, 2008
Thursday, June 12, 2008
Grad Party
Please, let me know if you are coming to the Grad Party. It will be at 12:00 in the H cafeteria on Wed, June 25.
Wednesday, June 4, 2008
Expressing changes in number and rate
Situation 1: In Toronto in 1990 the population was 100 and the number of obese people was 10. In 2000 the population was 110 and the number of obese people was 11.
- From 1990 to 2000, the total population in Toronto increased from 100 to 110.
- The population of Toronto increased by 10%.
- Although within the 10-year range, 1990 to 2000, the obesity rate in Toronto had stayed at 10%, it had increased to 20% in Hong Kong.
- In TO, the population grew from 100 in 1990 to 110 in 2000, but the number of obese people changed from 10 to 11 in this decade.
- In the decade beginning in 1990, the number of obese in Toronto rose by 10.
- In the ten years ending in 2000, the number of obese in TO increased to 110.
- In the ten years ending in 2000, the number of obese in TO remained at 10%.
- In 1990 the amount of obese people in Hong Kong was 10 and it has incrased to 22 in 2000.
Situation 3: Other
- From time 1 to time 2 the increased consumption of energy was from 10 to 20%.
Subscribe to:
Posts (Atom)